Every quarter, you approve millions in IT spending for data storage, analytics platforms, and compliance systems. Your data infrastructure costs are growing 42.2% annually according to IDC, yet these investments remain firmly planted in the “cost center” column of your financial statements.
Meanwhile, the global data monetization market has reached $4.15 billion in 2024 and is projected to grow to $41.25 billion by 2034—a 25.81% compound annual growth rate. Companies across every industry are transforming their data from a necessary expense into a strategic revenue generator.
The question isn’t whether data monetization works. The question is: What would the financial impact be if your organization stopped treating data as overhead and started treating it as inventory?
This guide provides the financial frameworks, ROI calculations, and risk assessment methodologies that forward-thinking CFOs use to evaluate and justify data monetization investments.
The Current State: Data as a Growing Cost Center
Understanding Your True Data Costs
Most organizations significantly underestimate the total cost of their data infrastructure. A comprehensive data cost analysis includes:
Direct Infrastructure Costs:
- Storage systems and cloud data services
- Analytics platforms and business intelligence tools
- Data integration and ETL pipeline tools
- Backup and disaster recovery systems
- Compliance and governance platforms
Indirect Operational Costs:
- Data engineering and analytics team salaries
- Business analyst time spent on data tasks
- IT support and maintenance overhead
- Compliance and audit costs
- Opportunity cost of delayed decision-making
Hidden Productivity Costs: According to Market Logic research, employees spend an average of 1.8 hours daily searching for information they can’t find. For organizations with 100+ employees, this inefficient data discovery costs approximately $1.7 million annually in lost productivity.
Typical Enterprise Data Cost Structure:
| Cost Category | Annual Range | % of Total Data Budget |
|---|---|---|
| Infrastructure & Platforms | $500K – $3M | 40-45% |
| Personnel Costs | $800K – $5M | 45-50% |
| Compliance & Governance | $100K – $800K | 5-8% |
| Opportunity Costs | $200K – $1.5M | 7-12% |
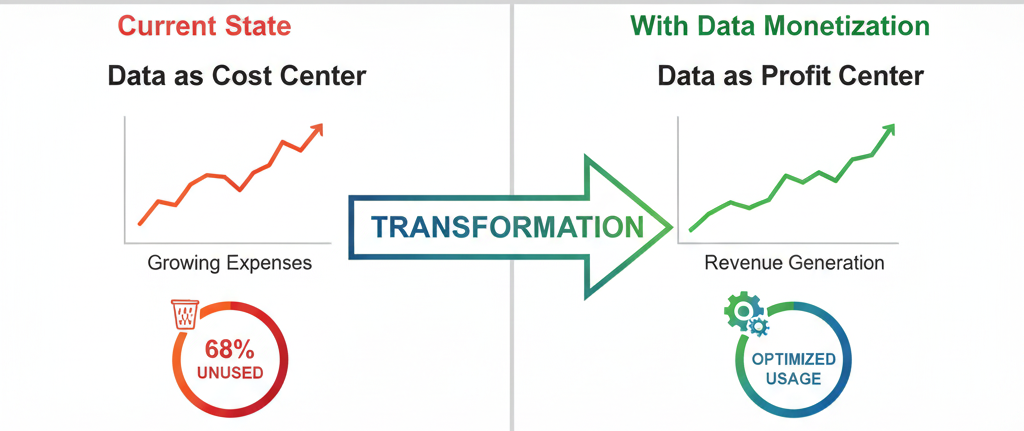
The Waste Factor: 68% Unused Data Assets
Seagate’s comprehensive study of 1,500 global enterprise leaders revealed that 68% of available enterprise data goes completely unused. From a financial perspective, this means you’re paying full price for storage, processing, and management of assets that generate zero return.
Financial Impact of Data Waste:
- Storage costs for unused data: 68% of total storage budget
- Processing overhead for irrelevant data: 40-60% of analytics compute costs
- Team time spent managing unusable data: 30% of data engineering resources
For a mid-size enterprise spending $2 million annually on data infrastructure, unused data waste represents approximately $1.36 million in direct costs with no corresponding business value.
Data Monetization ROI Framework
The Four Revenue Stream Model
Data monetization generates returns through four distinct channels, each with different ROI characteristics:
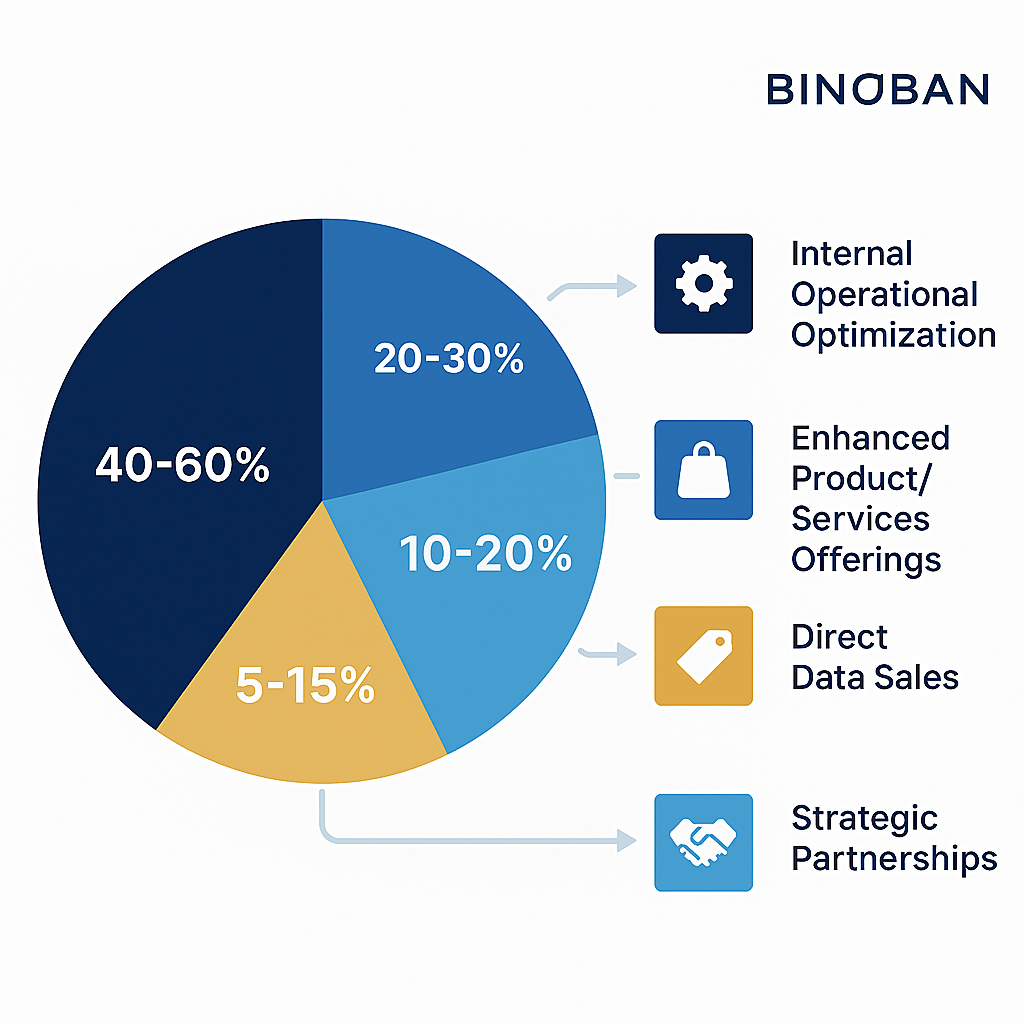
1. Internal Operational Optimization (40-60% of total ROI)
- Cost reduction through improved efficiency
- Better decision-making reducing waste and errors
- Automated processes replacing manual operations
- ROI Timeline: 3-6 months
- Risk Level: Low
- Typical Returns: 15-30% operational cost reduction
2. Enhanced Product/Service Offerings (20-30% of total ROI)
- Data-driven features that command premium pricing
- Improved customer experiences driving retention
- Personalization increasing average revenue per customer
- ROI Timeline: 6-12 months
- Risk Level: Medium
- Typical Returns: 10-25% revenue increase per enhanced product
3. Direct Data Sales (10-20% of total ROI)
- Licensing data to third parties
- API monetization and usage-based pricing
- One-time data asset sales
- ROI Timeline: 9-18 months
- Risk Level: Medium-High
- Typical Returns: New revenue stream $100K-$2M annually
4. Data-Driven Strategic Partnerships (5-15% of total ROI)
- Joint ventures leveraging combined data assets
- Revenue sharing from ecosystem partnerships
- Platform business model development
- ROI Timeline: 12-24 months
- Risk Level: High
- Typical Returns: Variable, potentially transformative
ROI Calculation Methodology
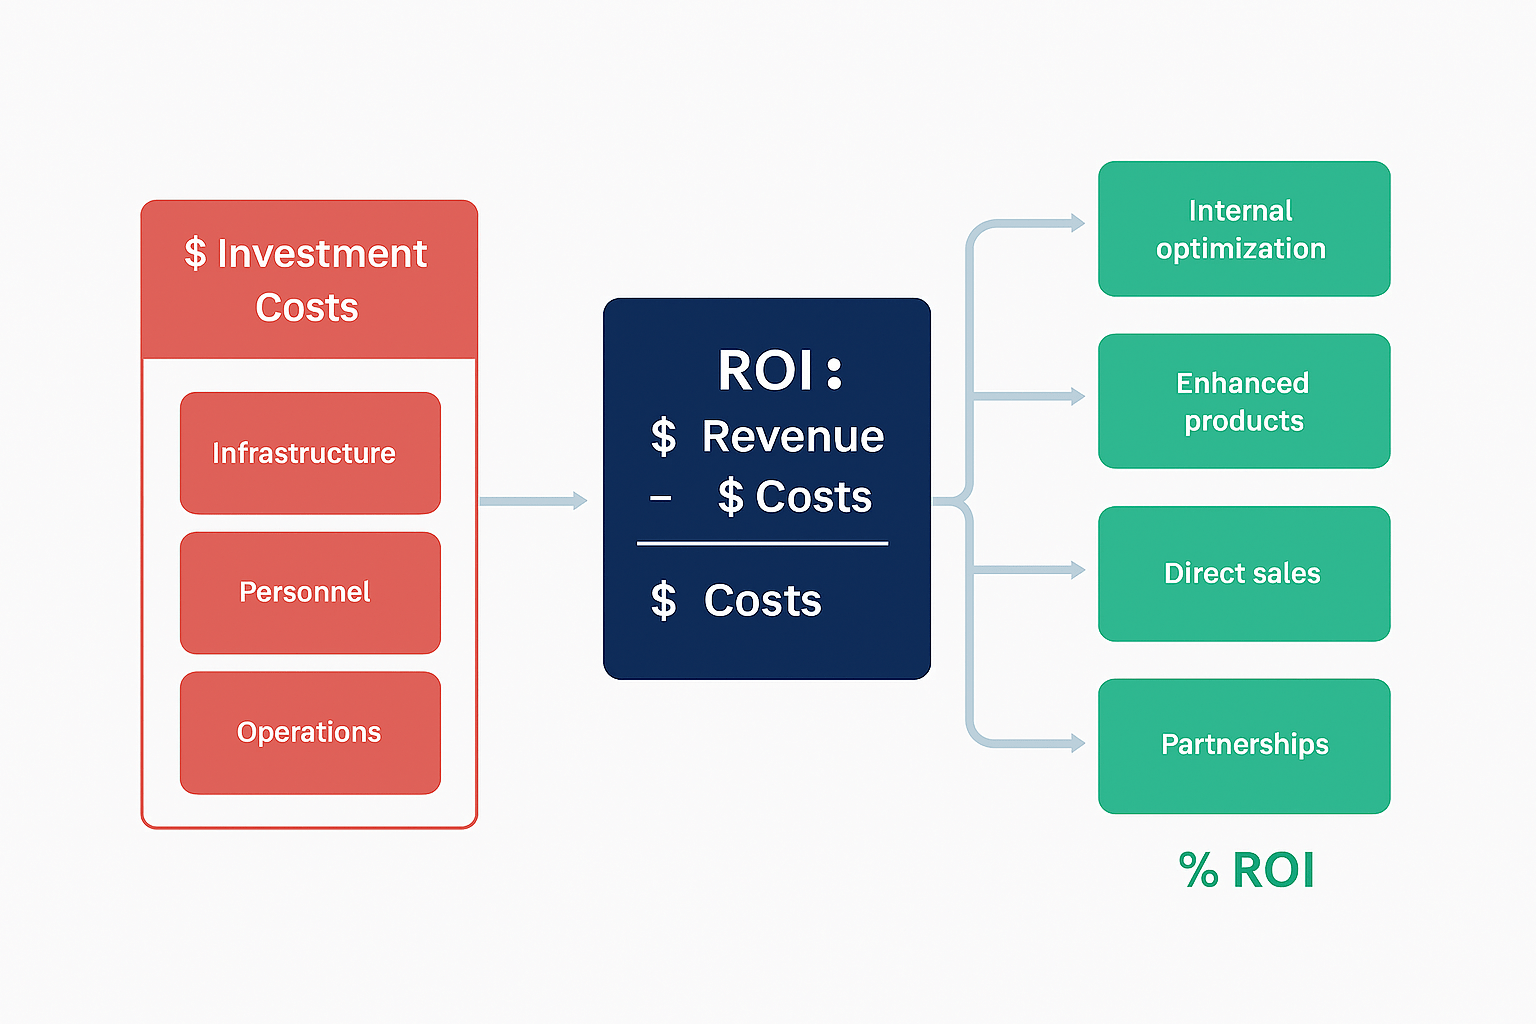
Basic ROI Formula for Data Monetization:
ROI = (Total Revenue Generated + Cost Savings - Investment Costs) / Investment Costs × 100
Comprehensive Financial Model:
Year 1 Investment Costs:
- Platform development: $200K – $800K
- Infrastructure upgrades: $150K – $600K
- Personnel additions: $300K – $1.2M
- Compliance and legal: $50K – $200K
- Total Year 1 Investment: $700K – $2.8M
Year 1 Returns:
- Operational cost savings: $300K – $1.5M (15-30% of operational costs)
- Revenue enhancement: $200K – $1M (5-15% revenue increase)
- Direct data sales: $100K – $500K (conservative first-year projection)
- Total Year 1 Returns: $600K – $3M
Conservative ROI Calculation Example:
- Investment: $1.2M
- Year 1 Returns: $1.8M
- Year 1 ROI: 50%
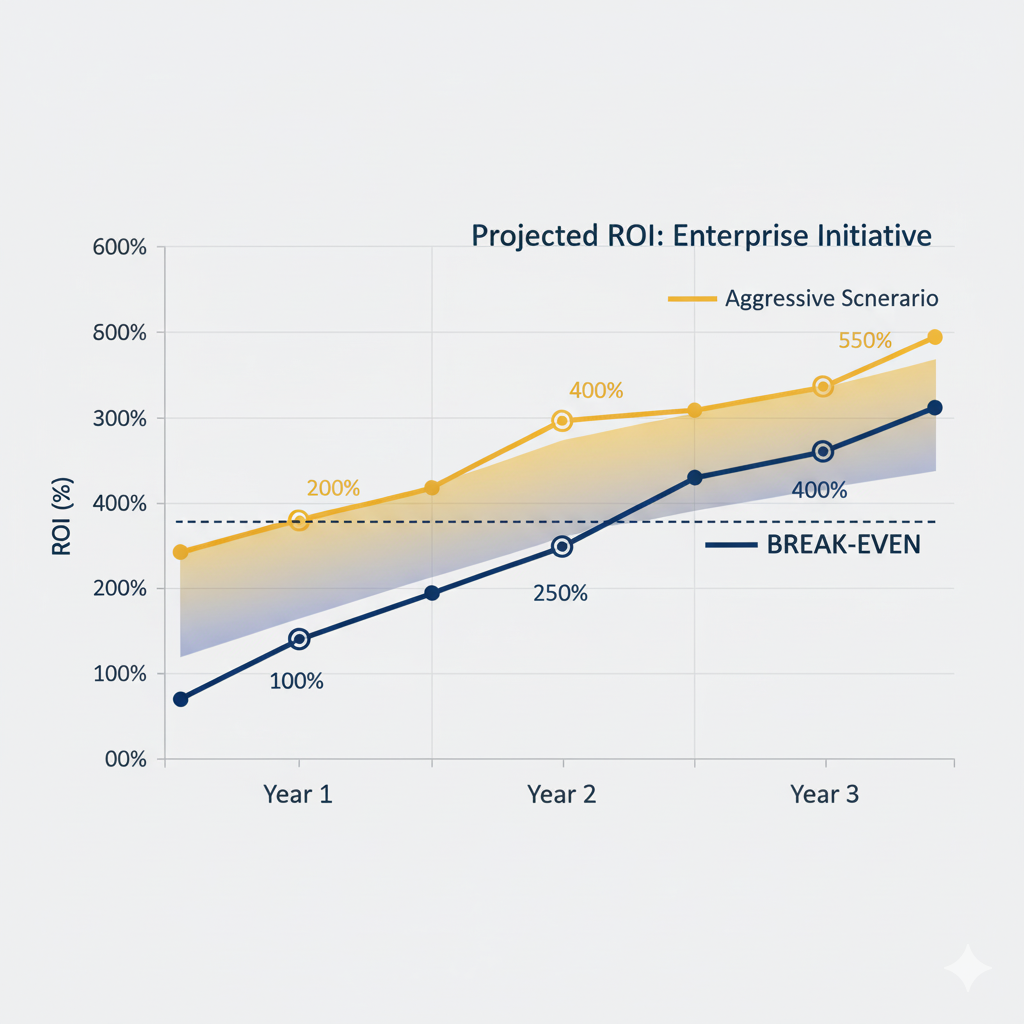
Three-Year Compound Returns:
- Year 2 Returns: $2.4M (33% growth)
- Year 3 Returns: $3.2M (33% growth)
- Three-Year Cumulative ROI: 500%
Industry-Specific ROI Benchmarks
Financial Services:
- Average investment: $1.5M – $4M
- Typical 3-year ROI: 300-600%
- Primary value: Risk modeling, customer insights, regulatory compliance optimization
Manufacturing:
- Average investment: $800K – $2.5M
- Typical 3-year ROI: 250-500%
- Primary value: Predictive maintenance, quality optimization, supply chain intelligence
Retail/E-commerce:
- Average investment: $600K – $2M
- Typical 3-year ROI: 400-800%
- Primary value: Customer personalization, inventory optimization, market intelligence
Healthcare:
- Average investment: $1M – $3.5M
- Typical 3-year ROI: 200-400%
- Primary value: Operational efficiency, patient outcomes, research insights
Financial Modeling Framework
Building the Business Case
Phase 1: Current State Analysis (Month 1)
Establish baseline metrics across five financial dimensions:
1. Data Infrastructure Costs
Current Annual Data Costs:
├── Storage and compute: $X
├── Platform licensing: $Y
├── Personnel costs: $Z
├── Opportunity costs: $W
└── Total: $(X+Y+Z+W)

Data Utilization Rate: 32% (industry average)
Effective Cost per Utilized GB: $Cost/0.32
2. Revenue Enhancement Potential
Current Revenue Streams Analysis:
├── Products enhanced by data: $A
├── Customer segments with data needs: B customers
├── Pricing premium opportunity: C%
└── Total addressable internal market: $(A × 1.C)
3. Cost Reduction Opportunities
Process Inefficiency Analysis:
├── Manual tasks automatable with data: D hours/month
├── Decision delays due to data access: E days average
├── Error rates reducible through data insights: F%
└── Total cost reduction potential: $(D×hourly_rate + E×delay_cost + F×error_cost)
Phase 2: Investment Requirements Planning (Month 2)
Technology Infrastructure Investments:
- Real-time data pipeline architecture: $200K – $600K
- API development and management platform: $100K – $300K
- Analytics and visualization tools: $150K – $400K
- Security and compliance enhancements: $100K – $250K
Personnel Investments:
- Data product manager: $120K – $180K annually
- Data engineers (2-3 FTE): $200K – $350K annually
- Business analysts: $150K – $250K annually
- Customer success specialist: $80K – $120K annually
Operational Investments:
- Legal and compliance review: $50K – $150K
- Marketing and sales enablement: $75K – $200K
- Customer onboarding systems: $50K – $100K
Quarter-by-Quarter Revenue Projections
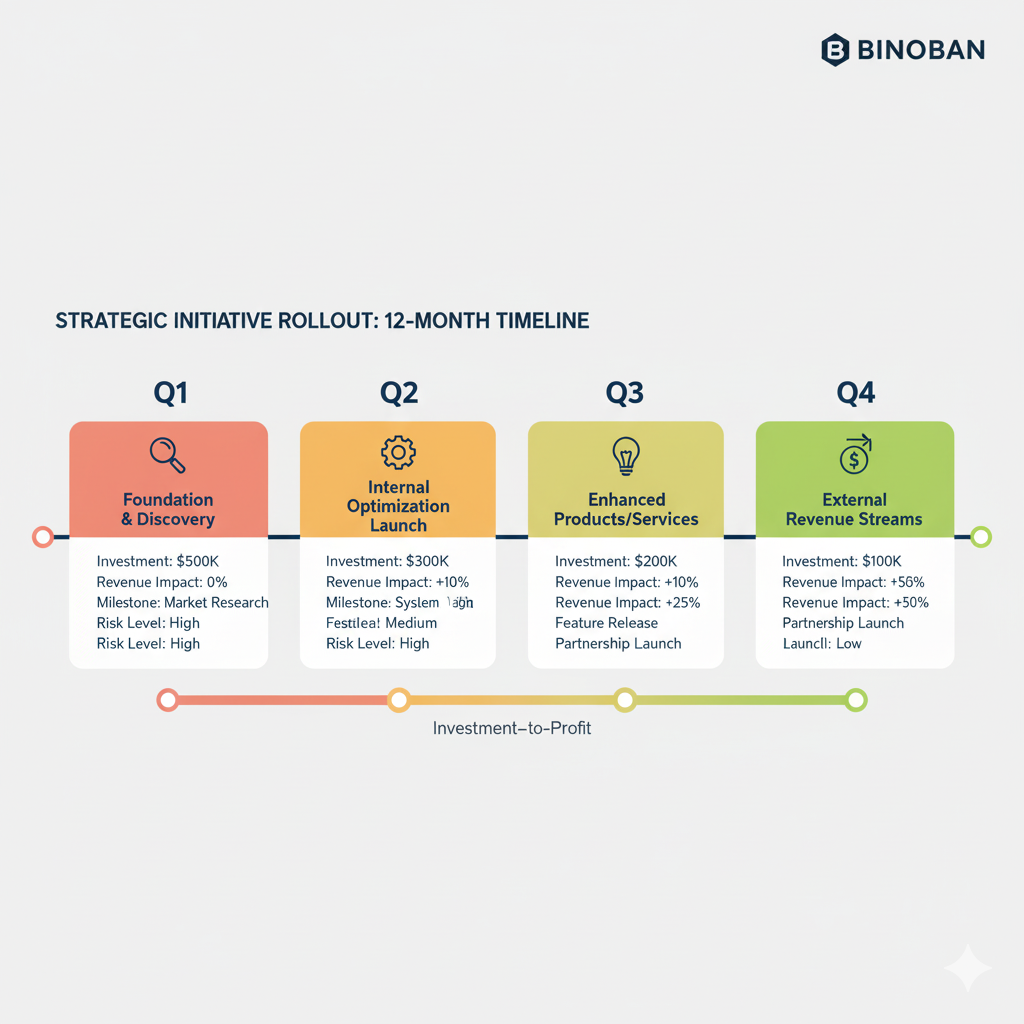
Q1: Foundation and Discovery
- Revenue Impact: $0
- Investment: 60% of total budget
- Focus: Infrastructure development, team building
- Key Metrics: Project milestones, data quality improvements
Q2: Internal Optimization Launch
- Revenue Impact: $50K – $200K (cost savings)
- Investment: 30% of total budget
- Focus: Process automation, decision support systems
- Key Metrics: Operational efficiency gains, cost reduction
Q3: Enhanced Products/Services
- Revenue Impact: $100K – $400K (revenue enhancement)
- Investment: 10% of total budget
- Focus: Customer-facing data features, pricing optimization
- Key Metrics: Customer satisfaction, retention rates, ARPU
Q4: External Revenue Streams
- Revenue Impact: $150K – $600K (new revenue)
- Investment: Ongoing operational costs
- Focus: Data product sales, API monetization
- Key Metrics: External customer acquisition, recurring revenue
Risk Assessment and Mitigation
Financial Risks:
1. Technology Risk (Probability: 25%, Impact: $200K – $500K)
- Risk: Infrastructure complexity exceeds planning assumptions
- Mitigation: Phased implementation with proven technologies
- Contingency: 15% budget buffer for technical challenges
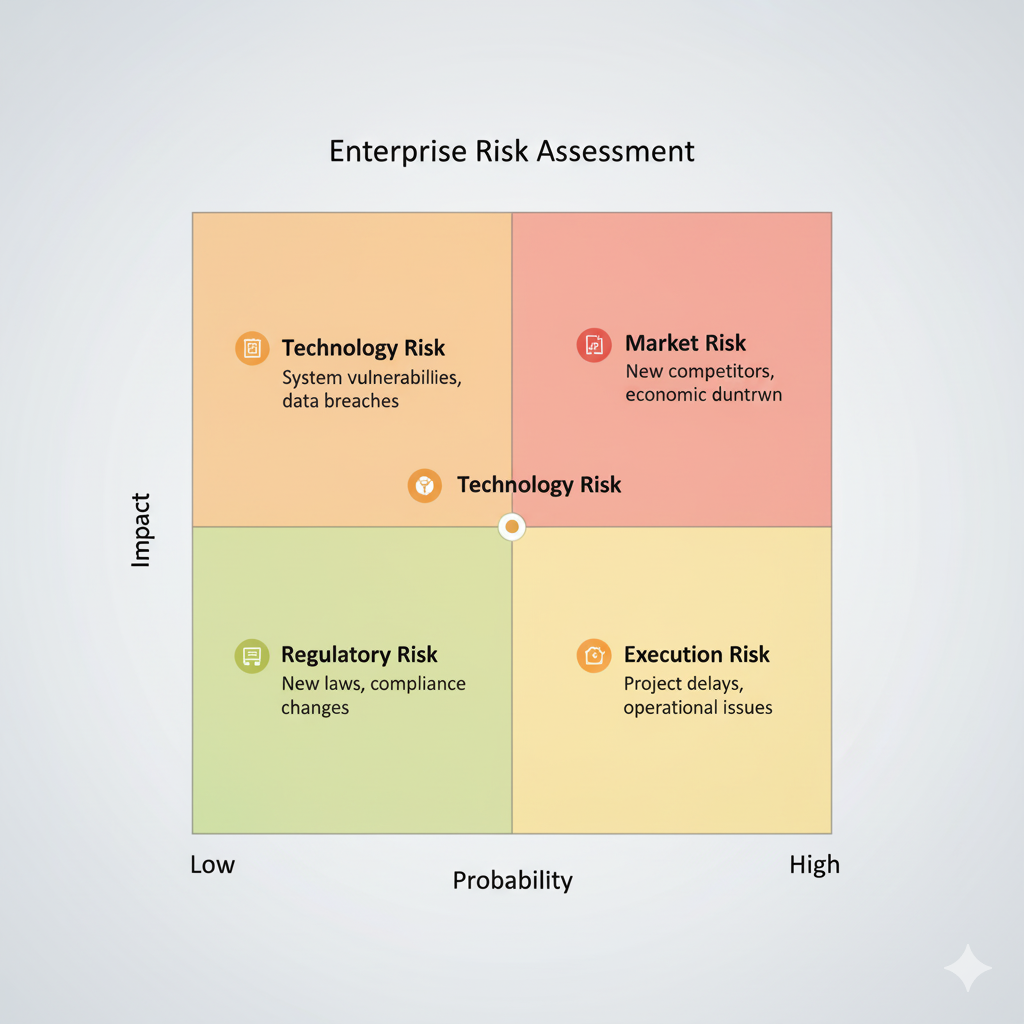
2. Market Risk (Probability: 30%, Impact: $300K – $800K)
- Risk: External demand for data products lower than projected
- Mitigation: Focus on internal ROI first, external revenue as upside
- Contingency: Pivot strategy to internal optimization focus
3. Regulatory Risk (Probability: 20%, Impact: $100K – $400K)
- Risk: Compliance requirements limit monetization options
- Mitigation: Legal review before product development
- Contingency: Privacy-first product design, synthetic data generation
4. Execution Risk (Probability: 35%, Impact: $250K – $600K)
- Risk: Team capabilities or organizational change management issues
- Mitigation: Experienced hire or consulting support
- Contingency: Extended timeline with additional training investment
Risk-Adjusted ROI Calculation:
Expected ROI = (Probability of Success × Projected ROI) - (Sum of Risk Impacts × Risk Probabilities)

Conservative Scenario: (70% × 300%) - (25% × 15% + 30% × 20% + 20% × 10% + 35% × 18%) = 198% three-year ROI

Aggressive Scenario: (85% × 600%) - (15% × 10% + 20% × 15% + 10% × 8% + 25% × 12%) = 499% three-year ROI
Capital Allocation Strategy
Funding Models
1. Innovation Budget Allocation (Recommended)
- Source: Existing IT innovation or R&D budget
- Advantage: Aligns with strategic technology investments
- Timeline: Standard annual budgeting process
- Risk: Lower, fits existing funding frameworks
2. Revenue Growth Investment
- Source: Marketing or sales budget reallocation
- Advantage: Direct alignment with revenue generation goals
- Timeline: Can be implemented mid-fiscal year
- Risk: Medium, requires demonstrable revenue pipeline
3. Operational Efficiency Budget
- Source: Process improvement or cost reduction initiatives
- Advantage: Self-funding through demonstrated cost savings
- Timeline: Quarterly budget reallocation possible
- Risk: Low, immediate operational benefits
4. Strategic Initiative Funding
- Source: Board-approved strategic investment fund
- Advantage: Largest potential budget, executive support
- Timeline: Requires board approval, longer sales cycle
- Risk: Higher scrutiny, must demonstrate transformative potential
Budget Allocation Framework
Year 1 Investment Distribution:
- Infrastructure (35%): Core technology platform and tools
- Personnel (45%): Team building and capability development
- Operations (15%): Legal, compliance, process development
- Contingency (5%): Risk mitigation and unforeseen costs
Years 2-3 Reinvestment Strategy:
- Scale infrastructure based on customer demand
- Add specialized roles (customer success, advanced analytics)
- Invest in advanced capabilities (AI/ML, predictive analytics)
- Geographic expansion or new product development
Measuring and Reporting ROI
Financial KPIs Dashboard
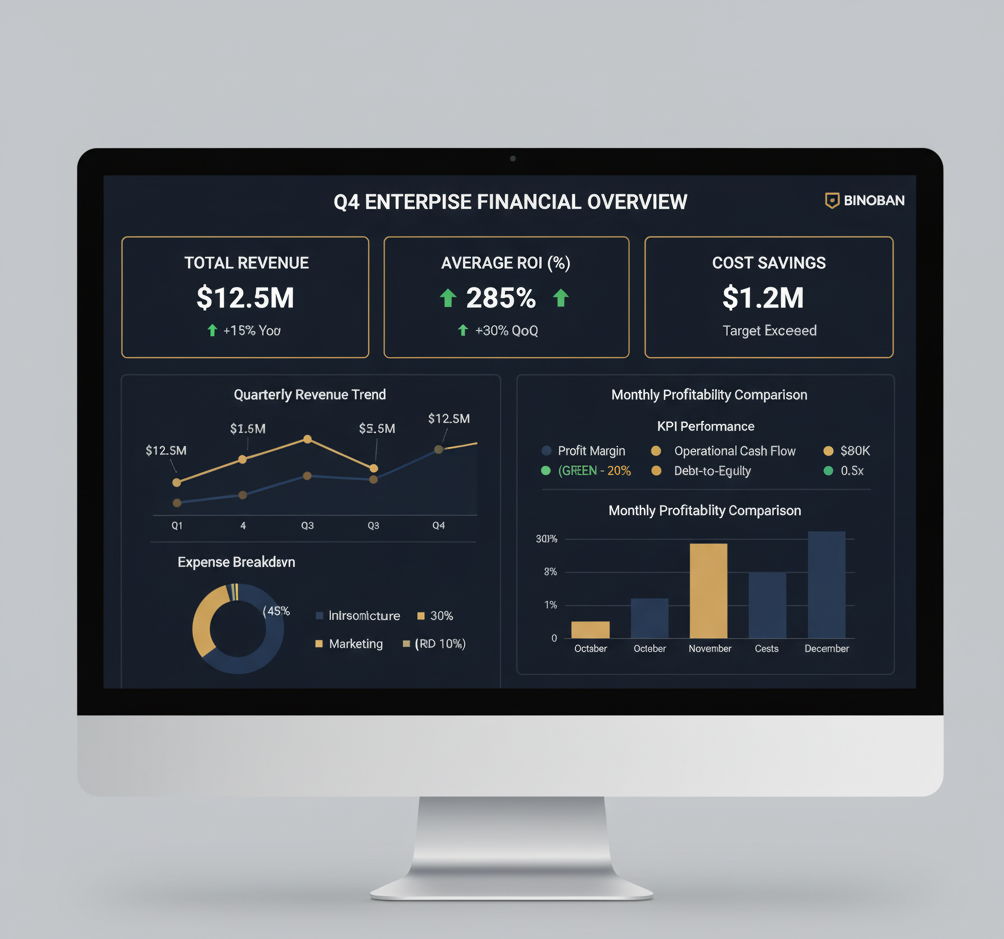
Primary Financial Metrics (Monthly Reporting):
- Total data monetization revenue ($ and growth %)
- Cost per dollar of data revenue generated
- Customer acquisition cost for data products
- Lifetime value of data customers
- Gross margin on data products vs. core business
Operational Efficiency Metrics (Quarterly Reporting):
- Cost savings from process automation
- Decision-making cycle time improvements
- Error rate reduction in data-driven processes
- Employee productivity improvements
- Data utilization rate improvements
Leading Indicators (Weekly Reporting):
- Data product usage trends
- Customer engagement metrics
- Pipeline of potential data partnerships
- Internal adoption of data-driven processes
Board-Level Reporting Template
Executive Summary Format:
Financial Performance:
- Current quarter data revenue: $X (+Y% vs. plan)
- Year-to-date ROI: Z% (target: W%)
- Cost savings realized: $A (B% of operational costs)
Strategic Progress:
- Data products launched: C (target: D)
- External customer acquisitions: E companies
- Internal process optimizations: F initiatives completed
Forward-Looking Projections:
- Next quarter revenue forecast: $G (+H% sequential growth)
- Full-year ROI projection: I% (confidence level: J%)
- Investment requirements for next phase: $K
Success Benchmarks by Timeline
Month 3 Benchmarks:
- Data infrastructure operational
- First internal optimization project delivering measurable cost savings
- Data governance framework implemented
- Team hired and productive
Month 6 Benchmarks:
- $100K+ in cost savings realized
- First enhanced product features launched
- Data quality metrics showing consistent improvement
- Customer feedback indicating value from data-driven features
Month 12 Benchmarks:
- $500K+ total ROI achieved
- External data product pilot programs launched
- Recurring revenue stream established
- Processes scalable for growth
Month 24 Benchmarks:
- 200%+ cumulative ROI
- Multiple external revenue streams operational
- Data monetization integrated into core business strategy
- Industry recognition as data-driven organization
Implementation Recommendations
CFO Action Plan
Immediate Actions (Next 30 Days):
- Conduct comprehensive data cost audit – quantify current total cost of data infrastructure
- Assess organizational readiness – evaluate team capabilities and technology gaps
- Identify quick-win opportunities – focus on internal optimization with measurable ROI
- Develop preliminary business case – use framework provided to model ROI scenarios
Short-term Initiatives (30-90 Days):
- Secure executive sponsorship – present business case to CEO and board
- Establish project funding – allocate budget from appropriate source
- Begin team building – hire key personnel or engage consulting support
- Launch first optimization project – demonstrate early ROI to build momentum
Medium-term Strategy (3-12 Months):
- Build monetization infrastructure – implement technical platform for data products
- Launch internal data products – enhance existing products/services with data
- Develop external revenue streams – pilot data sales or partnership programs
- Establish measurement systems – track ROI and optimize performance
Common Financial Pitfalls to Avoid
1. Underestimating Total Cost of Ownership Many organizations focus on direct technology costs while ignoring personnel, compliance, and organizational change costs. Budget 40-50% more than initial technology estimates.
2. Over-Optimistic Revenue Projections External data sales take longer to materialize than internal optimization benefits. Model conservative external revenue with aggressive internal savings.
3. Insufficient Risk Planning Data monetization involves regulatory, technology, and market risks. Maintain 15-20% contingency budget and have clear pivot strategies.
4. Lack of Incremental Measurement Without monthly ROI tracking, projects can drift off course. Implement measurement systems before launching initiatives.
Conclusion
The data economy represents a fundamental shift in how enterprises create and capture value. Organizations that continue to treat data as overhead will find themselves at a competitive disadvantage against companies that have transformed data into profit centers.
The financial case is compelling:
- Market growing 25.81% annually to $41.25 billion by 2034
- Proven ROI models showing 200-600% three-year returns
- Risk-adjusted returns significantly exceeding traditional technology investments
The strategic imperative is clear: Every day you delay data monetization, you’re paying full costs for assets that generate zero return while competitors build data-driven competitive advantages.
The question isn’t whether to invest in data monetization. The question is whether you’ll lead this transformation or be disrupted by it.
Ready to build your data monetization business case? Get your custom ROI analysis with specific projections for your industry and company size.
About BINOBAN: We help CFOs and finance leaders build compelling business cases for data monetization initiatives. Our proven ROI frameworks have supported over $127 million in identified data monetization opportunities. Schedule your financial assessment consultation.
Related Reading:
- Real-Time Data Pipeline Architecture: Building Enterprise-Grade Monetization Infrastructure
- Why Your Customer Data Platform Is Failing (And How Enterprise Leaders Are Fixing It)
- 5 Data Monetization Mistakes That Cost Enterprises Millions
- The Data Monetization Maturity Model: Where Does Your Enterprise Stand?